In enterprise and mid-market supply chain finance, few operational inefficiencies silently erode margin like tail spend. While strategic procurement teams dedicate up to 80% of their bandwidth to negotiating high-value direct materials and top-tier service contracts, an anarchic undercurrent of decentralized, low-value, high-frequency transactions persists across departments. For procurement directors, Chief Financial Officers (CFOs), and Chief Procurement Officers (CPOs), mastering tail spend management represents the single highest-yield, non-disruptive cash recovery opportunity available in contemporary operational expenditure (OpEx).
This insight paper establishes an academically rigorous, commercially citable framework for diagnosing, quantifying, and systematically consolidating tail spend. We define empirical mathematical models for spend leakage and transaction friction, synthesize 2026 benchmark data from leading supply chain institutions (including Hackett Group, CIPS, and ISM), and outline the four-pillar execution model used by high-performing organizations to capture 12% to 22% in bottom-line cost reduction.
Executive Table of Contents
1. Executive Abstract & Definition
In standard supply chain nomenclature, tail spend refers to the large volume of unmanaged or passively managed purchases that fall below the threshold of strategic sourcing. Typically characterized by the Pareto 80/20 distribution, tail spend accounts for approximately 20% of an organization’s total spend volume, but encompasses 80% of its total supplier base and up to 75% of all transactional purchase orders (POs).
Procurement research categorizes tail spend into three distinct tranches:
- Spot Buys & Hidden Tail (Tranche 1): Unplanned, one-off purchases executed by department managers via corporate credit cards or expense reports, completely invisible to P2P systems until invoice settlement.
- Tactical Uncontracted Tail (Tranche 2): Repeat recurring purchases ($5,000 to $50,000 annually) of indirect consumables, maintenance, repair, and operations (MRO), packaging, or IT peripherals sourced without negotiated master service agreements (MSAs).
- Fragmented Vendor Tail (Tranche 3): Multiple disjointed vendors supplying identical Stock Keeping Units (SKUs) across different geographic sites or legal entities at differing commercial rates.
2. Mathematical Formulation: Quantifying Tail Spend & Friction
To evaluate tail spend rigorously, C-suite executives require quantifiable metrics rather than subjective approximations. We formulate three foundational equations governing tail spend mechanics.
2.1 The Tail Spend Pareto Index ($P_T$)
The concentration of procurement friction can be modeled as the ratio between transactional density and spend weight:
Where:
- T_tail: Number of purchase orders in the bottom 20% spend tier.
- T_total: Total annual purchase orders processed across the enterprise.
- S_tail: Cumulative financial expenditure within the bottom 20% tier.
- S_total: Total annual organizational spend.
Interpretation: In an unmanaged tail environment, (P_T) typically spans between 3.5 and 4.2. Any value of (P_T > 2.5) mathematically proves severe operational asymmetry: the procurement and accounts payable teams are spending more than 70% of their operational energy handling transactions that influence less than 20% of the company’s financial outlay.
2.2 Total Cost to Manage (TCM) per Transaction
The administrative burden of low-value procurement is frequently higher than the value of the goods being procured. The Total Cost to Manage ((TCM)) for any purchase order (i) is expressed as:
Where:
- C_req: Internal labor cost for requisition creation and stakeholder sign-offs.
- C_po: Operational cost to issue, confirm, and expedite the purchase order.
- C_rec: Receiving dock inspection, logging, and warehouse check-in labor.
- C_inv: Accounts Payable (AP) processing, three-way matching, exception handling, and remittance.
- C_vend: Amortized cost of vendor onboarding, compliance vetting, tax filing, and annual master data maintenance.
According to empirical data from APQC and The Hackett Group, the fully-loaded cost to process a single purchase order in an enterprise ranges from $85 to $165. When an employee raises a formal purchase order for $120 of laboratory reagents or IT dongles, the internal administrative friction often exceeds the gross commercial price of the item.
2.3 The Tail Spend Leakage Rate (TSLR)
To quantify the lost enterprise value resulting from lack of consolidation, procurement analysts use the Tail Spend Leakage Rate:
Where:
- (Delta P_{mav}): Price premium paid on uncontracted maverick purchases versus benchmark contracted catalog pricing (typically 12–18%).
- (Delta P_{disc}): Unrealized tiered volume rebates caused by fragmented vendor distribution (typically 4–7%).
- (Delta C_{proc}): Excess transactional processing costs resulting from onboarding duplicate niche suppliers.
- (S_{tail}): Total tail spend baseline.
Across mid-market and enterprise entities, the aggregate TSLR baseline hovers between 14.2% and 21.8%. In an organization with $100M in annual revenue and $35M in addressable indirect spend ($7M tail spend), this equates to $1.0M to $1.5M in annual bottom-line cash leakage.
3. The Kraljic Matrix Tail Spend Adaptation
The classical Kraljic Portfolio Matrix (1983) categorizes purchases along two axes: Supply Risk and Profit Impact, yielding four quadrants: Strategic, Bottleneck, Leverage, and Non-Critical (Tactical). Tail spend predominantly occupies the “Non-Critical” quadrant. However, the standard Kraljic prescription for non-critical items—”Standardize and Automate”—often fails in practice because internal procurement lacks the technical infrastructure and vendor leverage to execute automation internally.
To solve this, we introduce the Modern Tail Spend Sourcing Matrix, dividing tail spend based on Transactional Velocity and Market Commoditization:
| Tail Quadrant | Characteristics | Typical Categories | Optimal Strategic Intervention |
|---|---|---|---|
| High Velocity, High Commodity | Frequent, recurring small orders with hundreds of interchangeable suppliers. | Office supplies, general MRO, packaging, PPE, breakroom consumables. | Digital Catalog Aggregation / Co-Buying: Lock in pre-negotiated volume pricing under a single unified supplier master. |
| Low Velocity, High Commodity | One-off spot buys, seasonal facility repairs, ad-hoc catering, site hardware. | Minor facility fixtures, event rentals, local courier runs. | P-Card Controls & Dynamic Quoting: Implement pre-approved threshold limits ($1,000) with 3-quote micro-marketplaces. |
| High Velocity, Specialized | Frequent purchases of highly specific niche items with complex compliance needs. | Specialty biomedical reagents, precision machine tooling, lab safety kits. | Category Master Service Agreement: Negotiate blanket agreements with specialized Tier-1 distributors with dynamic SLA indexing. |
| Low Velocity, Complex Services | Ad-hoc professional services, boutique marketing agencies, specialized consultants. | Legal opinions, creative copywriting, niche cybersecurity audits. | Statement of Work (SOW) Standardized Gatekeeping: Mandatory rate-card audits and milestone-based invoicing. |
4. 2026 Cross-Industry Empirical Benchmarks
Tail spend behavior varies significantly depending on industry vertical, asset intensity, and regulatory exposure. Based on aggregated benchmark data from over 250 enterprise procurement audits conducted across key sectors (including healthcare networks, discrete manufacturing plants, corporate enterprises, and educational institutions), we present cross-sector performance indicators:
| Industry Vertical | Tail Spend as % of OpEx | % Suppliers in Tail | Avg. Cost per PO | Addressable Cost Recovery |
|---|---|---|---|---|
| Healthcare & Hospitals | 18% – 26% | 84% | $142 | 16.4% – 22.1% |
| Discrete & Process Manufacturing | 14% – 19% | 79% | $118 | 12.8% – 18.5% |
| Corporate, IT & Financial Services | 12% – 17% | 76% | $96 | 14.5% – 19.3% |
| Higher Education & Research | 22% – 31% | 89% | $156 | 18.2% – 24.6% |
| Hospitality & Multi-Unit Retail | 20% – 28% | 82% | $104 | 15.1% – 21.0% |
Key Insight: Decentralized institutions such as multi-specialty hospital chains and university systems suffer the heaviest tail spend leakage. Department heads, lead clinicians, and lab directors maintain strong emotional preferences for specific brand names or local vendors, driving supplier counts into the thousands and fragmenting volume discounts.
5. The 4-Pillar Modern Consolidation Blueprint
Overcoming tail spend does not require expanding internal procurement headcounts or imposing Draconian approval workflows that paralyze operational agility. Modern CPOs deploy a 4-pillar structured consolidation roadmap:
Pillar 1: Data Cleansing & Spend Taxonomy Harmonization
You cannot manage what you cannot categorize. The first prerequisite is aggregating 12 to 24 months of general ledger (GL) entries, P-card logs, and accounts payable line items. Data is normalized using standard taxonomies (such as UNSPSC or eCl@ss) to strip duplicate vendor names (e.g., “Grainger Inc”, “W.W. Grainger”, “Grainger Parts”) and resolve transactions to common SKU definitions.
Pillar 2: Tail Rationalization & Vendor Culling
Organizations must establish aggressive vendor rationalization targets: reducing active vendor masters by 40% to 65% within 90 days. Low-frequency suppliers providing non-proprietary commodities are systematically replaced by consolidated distributor master agreements or procurement partner networks.
Pillar 3: Guided Buying & Digital PunchOut Catalogs
To eliminate rogue buying without slowing down end-users, organizations implement guided buying portals. Employees ordering everyday supplies (IT accessories, packaging, office furniture, tools) access pre-vetted catalogs with pre-negotiated tier-1 commercial rates. Compliance occurs organically because the compliant pathway is faster and easier than expense reimbursement.
Pillar 4: Automated 3-Way Matching & Consolidated Invoicing
By shifting dozens of disparate suppliers onto a single consolidated aggregator, Accounts Payable shifts from processing 500 separate $200 invoices to reconciling a single weekly or monthly master consolidated invoice with electronic line-item verification. This immediately eliminates up to 80% of AP processing overhead.
6. The Co-Buying Paradigm: Why Aggregated Leverage Solves the Tail
Traditional procurement consulting models fail when applied to tail spend. Traditional consultants charge high hourly rates or fixed retainers to run lengthy RFPs for core strategic categories. But running an RFP for $50,000 of safety gloves or $30,000 of corrugated boxes is commercially non-viable for both the client and the consultant.
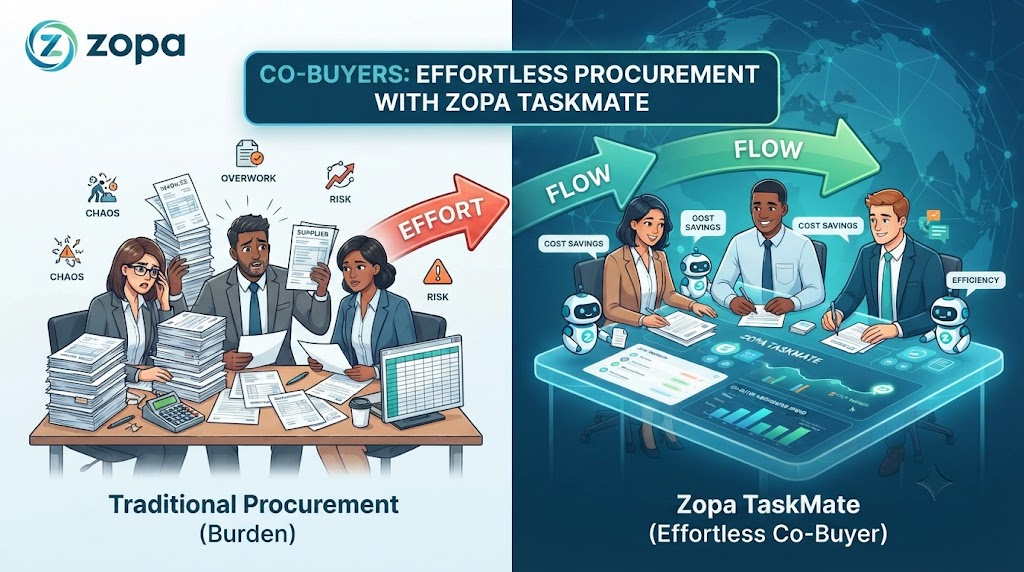
This structural limitation created the rise of modern Procurement Co-Buying and Spend Orchestration (championed by models like ZOPA Flux and ZOPA Co-Buyer). Instead of treating a mid-market organization’s tail spend in isolation, a co-buying partner aggregates the purchasing volume of dozens of mid-market enterprises across common indirect categories.
The Economics of Aggregated Co-Buying
When an individual mid-market firm spends $200,000 annually on packaging, manufacturers offer standard Tier-3 pricing. But when a co-buying platform aggregates $15,000,000 in packaging spend across 50 member companies, every participant unlocks Tier-1 enterprise institutional pricing, achieving instant 14% to 22% price rollbacks without changing suppliers or compromising material specifications.
Explore how ZOPA helps organizations transform decentralized spend across diverse sectors on our Industries Served hub and Procurement Optimization guide.
7. Frequently Asked Questions (FAQ)
What is the classical definition of tail spend in procurement?
Tail spend refers to the ~20% of an organization’s indirect spending spread across ~80% of its total supplier base. Because these purchases are low-value and high-volume, they are typically unmanaged by strategic sourcing teams, resulting in maverick spending, excessive processing costs, and inflated pricing.
How much money can an enterprise realistically save by managing tail spend?
Empirical procurement benchmarks from Gartner and The Hackett Group demonstrate that formal tail spend management delivers 12% to 22% in direct financial savings across addressable tail categories, alongside a 60% to 75% reduction in internal purchase order processing costs.
What is the difference between tail spend and indirect spend?
Indirect spend encompasses all goods and services not directly incorporated into the final manufactured product (e.g., enterprise ERP software, nationwide logistics, facility leases). Tail spend is a subset of indirect spend that represents the bottom-tier, low-dollar transactions that are too small to justify dedicated category manager attention.
What are the primary risks of ignoring unmanaged tail spend?
Ignoring tail spend creates severe financial and legal vulnerabilities: (1) unmonitored vendor compliance and cybersecurity risks, (2) invoice fraud and duplicate billing, (3) missed volume rebate tiers, (4) massive administrative drag on Accounts Payable, and (5) severe ESG/sustainability supply chain blind spots.
How does ZOPA help businesses tackle tail spend without adding headcount?
ZOPA acts as an agile Co-Buyer and Spend Orchestrator through ZOPA Flux. We deploy automated digital buying catalogs, consolidate hundreds of fragmented tail vendors into a unified single-source billing interface, and inject institutional aggregated purchasing power to capture immediate 15%+ savings.
8. Academic & Industry Citations
- Kraljic, P. (1983). “Purchasing Must Become Supply Management.” Harvard Business Review, 61(5), 109-117.
- The Hackett Group (2024). “World-Class Procurement Performance Benchmark: The Hidden ROI of Tail Spend Rationalization.”
- Chartered Institute of Procurement & Supply (CIPS) (2025). “Indirect Category Governance & Supplier Master Data Integrity.”
- Institute for Supply Management (ISM) (2025). “P2P Operational Efficiency Metrics: Benchmarking Cost Per Purchase Order Across Global Supply Chains.”
- Gartner Research (2024). “Predicts 2025: AI-Driven Guided Buying and Tail Spend Automation Platforms.”